
evening breeze / Taizo
799 字
4 分钟
pyecharts配置项
pyecharts配置项
from pyecharts.globals import CurrentConfig, NotebookTypeCurrentConfig.NOTEBOOK_TYPE = NotebookType.JUPYTER_LABfrom pyecharts.charts import Bar,Linefrom pyecharts import options as opts
from pyecharts.faker import Fakerfrom pyecharts.globals import ThemeType,RenderTypeFaker.choose()['河马', '蟒蛇', '老虎', '大象', '兔子', '熊猫', '狮子']全局配置项
c = ( Bar( #初始化配置项 init_opts=opts.InitOpts( width='900px', height='500px', renderer=RenderType.CANVAS, #渲染风格 page_title='网页标题', theme=ThemeType.WHITE, #主题 bg_color='white' ) ) .add_xaxis(Faker.choose()) .add_yaxis('商家A',Faker.values()) .add_yaxis('商家B',Faker.values())
#全局配置项 .set_global_opts( title_opts=opts.TitleOpts( title='柱形图', title_link='https://www.baidu.com', title_target='blank', #self是在当前页面打开 subtitle='副标题', subtitle_link='https://meteor-comet.github.io', subtitle_target='blank', pos_left='20%', #right/left/center/10px pos_top=0, #pos_bottom,pos_right padding=20, #内边距 item_gap=5, #主标题和副标题之间间距 ),
#区域缩放配置项 datazoom_opts=opts.DataZoomOpts( is_show=True, #是否显示组件 type_='slider', #组件类型 inside/slider is_realtime=True, #拖动时是否实时更新图表 range_start=20, #数据窗口起始百分比 range_end=80, #数据窗口结束百分比 orient='horizontal', #horizontal水平放,vertical垂直放(y轴数据份范围) is_zoom_lock=False, #是否锁定选择区域 ),
#图例配置项 legend_opts=opts.LegendOpts( #图例类型: plain普通图例,scroll:可以滚动翻页的图例,用于图例较多的情况 type_='plain', is_show=True, pos_left='center', #图例位置同上 orient='vertical', #horizontal水平放,vertical垂直放 #选择模式 True:开启图例点击 False:关闭图例点击 # single:单选 multiple:多选 selected_mode='multiple', #图表和文字的位置 align='left', padding=15, item_gap=5, #图例之间间距 #图例的宽高 item_width=30, item_height=15, inactive_color='#ccc',#图例关闭时显示的颜色 #textstyle_opts=opts.TextStyleOpts(color='red'), #图例字体颜色 #Pyecharts常见图例 legend_icon='roundRect',#circle,rect,roundRect,triangle,diamond,arrow ),
#视觉映射配置项 visualmap_opts=opts.VisualMapOpts( is_show=True, type_='color', # color/size min_=0, #最小值 max_=150, #最大值 range_opacity=0.8, #透明度 range_text=['max','min'],#两段文本 #range_color=['#E7C2CA','#29AFD4','#E6755F'], #过渡色 orient='vertical',#horizontal水平放,vertical垂直放 pos_right=0, pos_top='20%', is_piecewise=True, #是否分段 # is_inverse=True, #是否反转 ),
#提示框配置项 tooltip_opts=opts.TooltipOpts( is_show=True, #触发类型 # item:数据项,一般用于:散点图,柱形图,饼图 # axis: 坐标轴。提示线,主要用于条形图,折线图等 trigger='item', #触发条件 #mousemove,click,mousemove/click trigger_on='mousemove', is_show_content=True, #是否显示提示框浮层 #标签内容的格式 #字符串中的模板变量: # {a}:系列名series_name # {b}:数据名 # {c}:值 #formatter='{a}:{b}:{c}', #background_color='auto', #提示框背景色 border_width=1, border_color='blue' ),
#AxisOpts: 坐标轴配置项 xaxis_opts=opts.AxisOpts( is_show=True, #是否显示X轴 #坐标轴类型: #value:数值轴,用于连续数据 #category:类目轴,适用于离散数据,比如周一周二 #time:时间轴,用于连续的时序数据 type_='category', ), yaxis_opts=opts.AxisOpts( # is_show=False, #不显示Y轴的线 axisline_opts=opts.AxisLineOpts(is_show=False), #不显示Y轴的刻度 axistick_opts=opts.AxisTickOpts(is_show=False), ), ))c.load_javascript()c.render_notebook()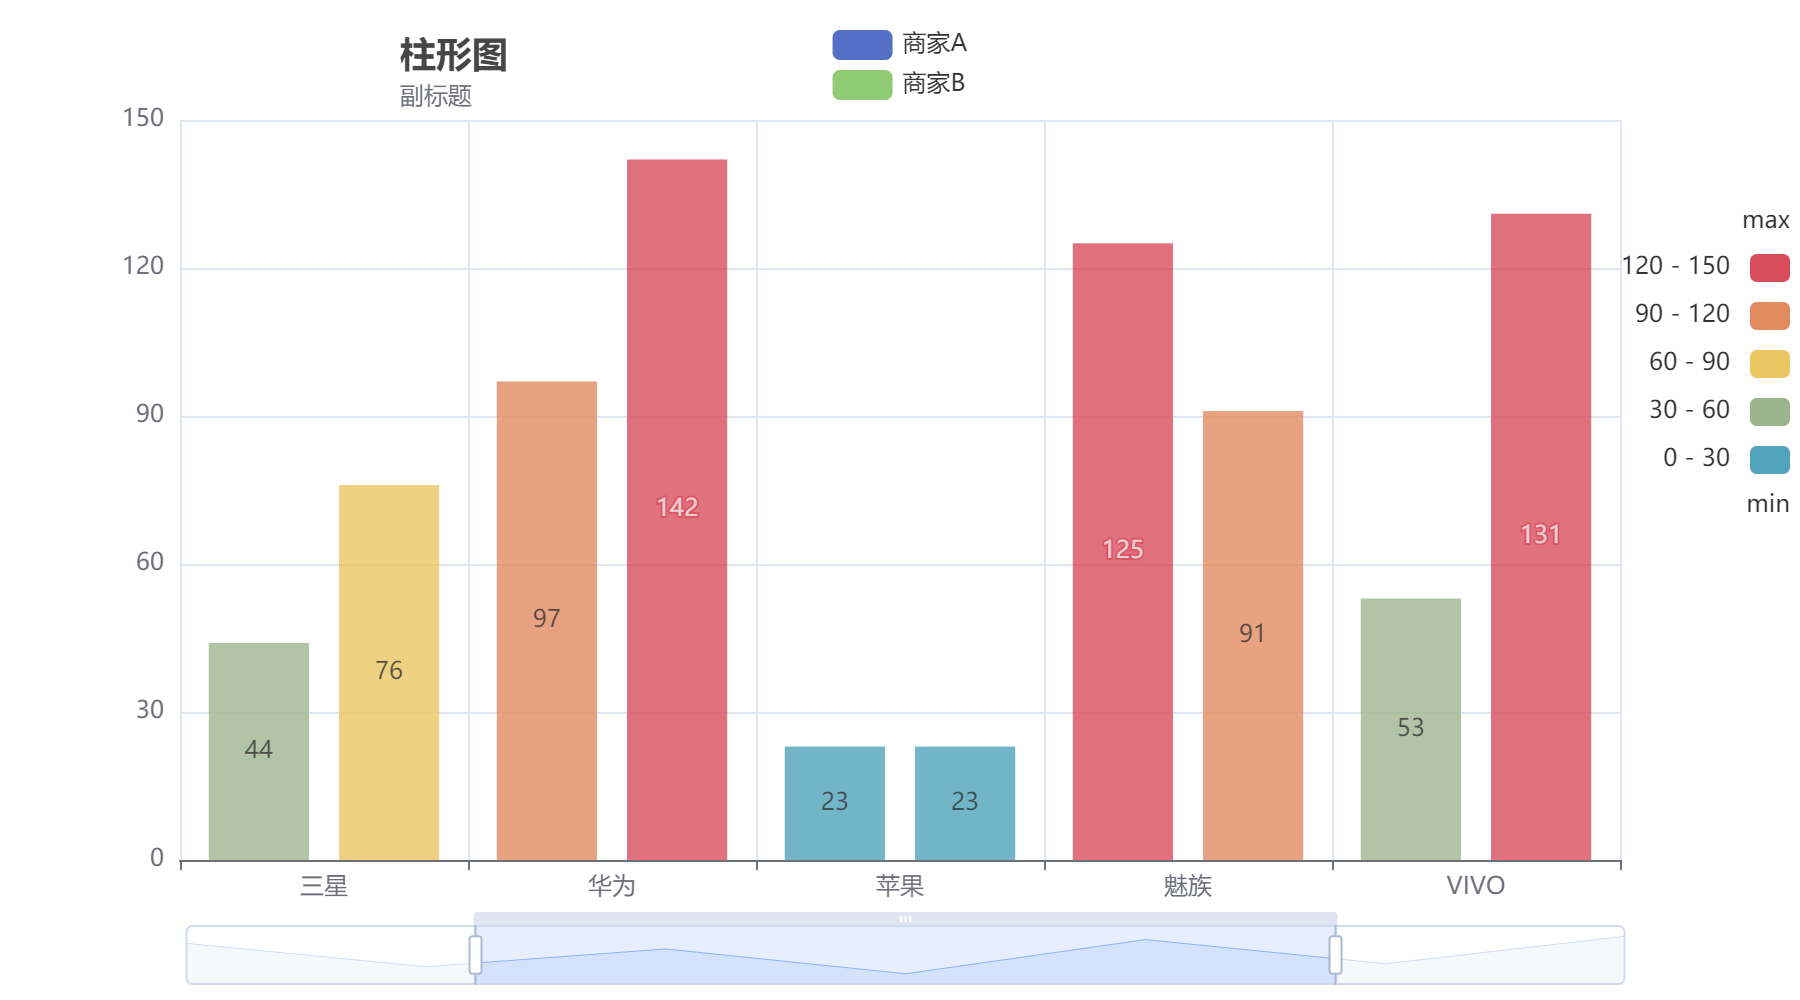
系列配置项
d = ( Line( #初始化配置项 init_opts=opts.InitOpts( width='900px', height='500px', renderer=RenderType.CANVAS, #渲染风格 page_title='网页标题', theme=ThemeType.WHITE, #主题 bg_color='white' ) ) .add_xaxis(Faker.choose()) .add_yaxis('商家A',Faker.values()) .add_yaxis('商家B',Faker.values())
#全局配置项 .set_global_opts( title_opts=opts.TitleOpts(title='折线图'), #提示线 tooltip_opts=opts.TooltipOpts(trigger='axis'), )
#系列配置项 .set_series_opts( #图元样式配置项 itemstyle_opts=opts.ItemStyleOpts( #图的颜色,使用纯色/RGB/RGBA/#ccc # color='red', opacity=0.8, #透明度 # border_type='dotted', border_width=20 ),
#线样式配置项 linestyle_opts=opts.LineStyleOpts( is_show=True, width=5, # color='blue', type_='solid', #solid,dashed,dotted ),
#标签配置项 label_opts=opts.LabelOpts( is_show=True, #数值在点的位置(top,left,right,bottom,inside,outside,insideleft) position='bottom', color='auto', font_size=20, font_style='italic', font_weight='bold', #标签旋转(-90,90) rotate=20 ),
#标记点配置项 markpoint_opts=opts.MarkPointOpts( data=[ #type_:特殊标记类型,min,max,average #symbol:cirecle,pin,roundRect,rect...不建议改 #symbol_size:标记点大小 opts.MarkPointItem(type_='max',symbol='pin',symbol_size=60), opts.MarkPointItem(type_='min',symbol='pin',symbol_size=60) ] ), markline_opts=opts.MarkLineOpts( data = [ opts.MarkLineItem(type_='average') ], label_opts=opts.LabelOpts( color='red' ) ) ))d.render_notebook()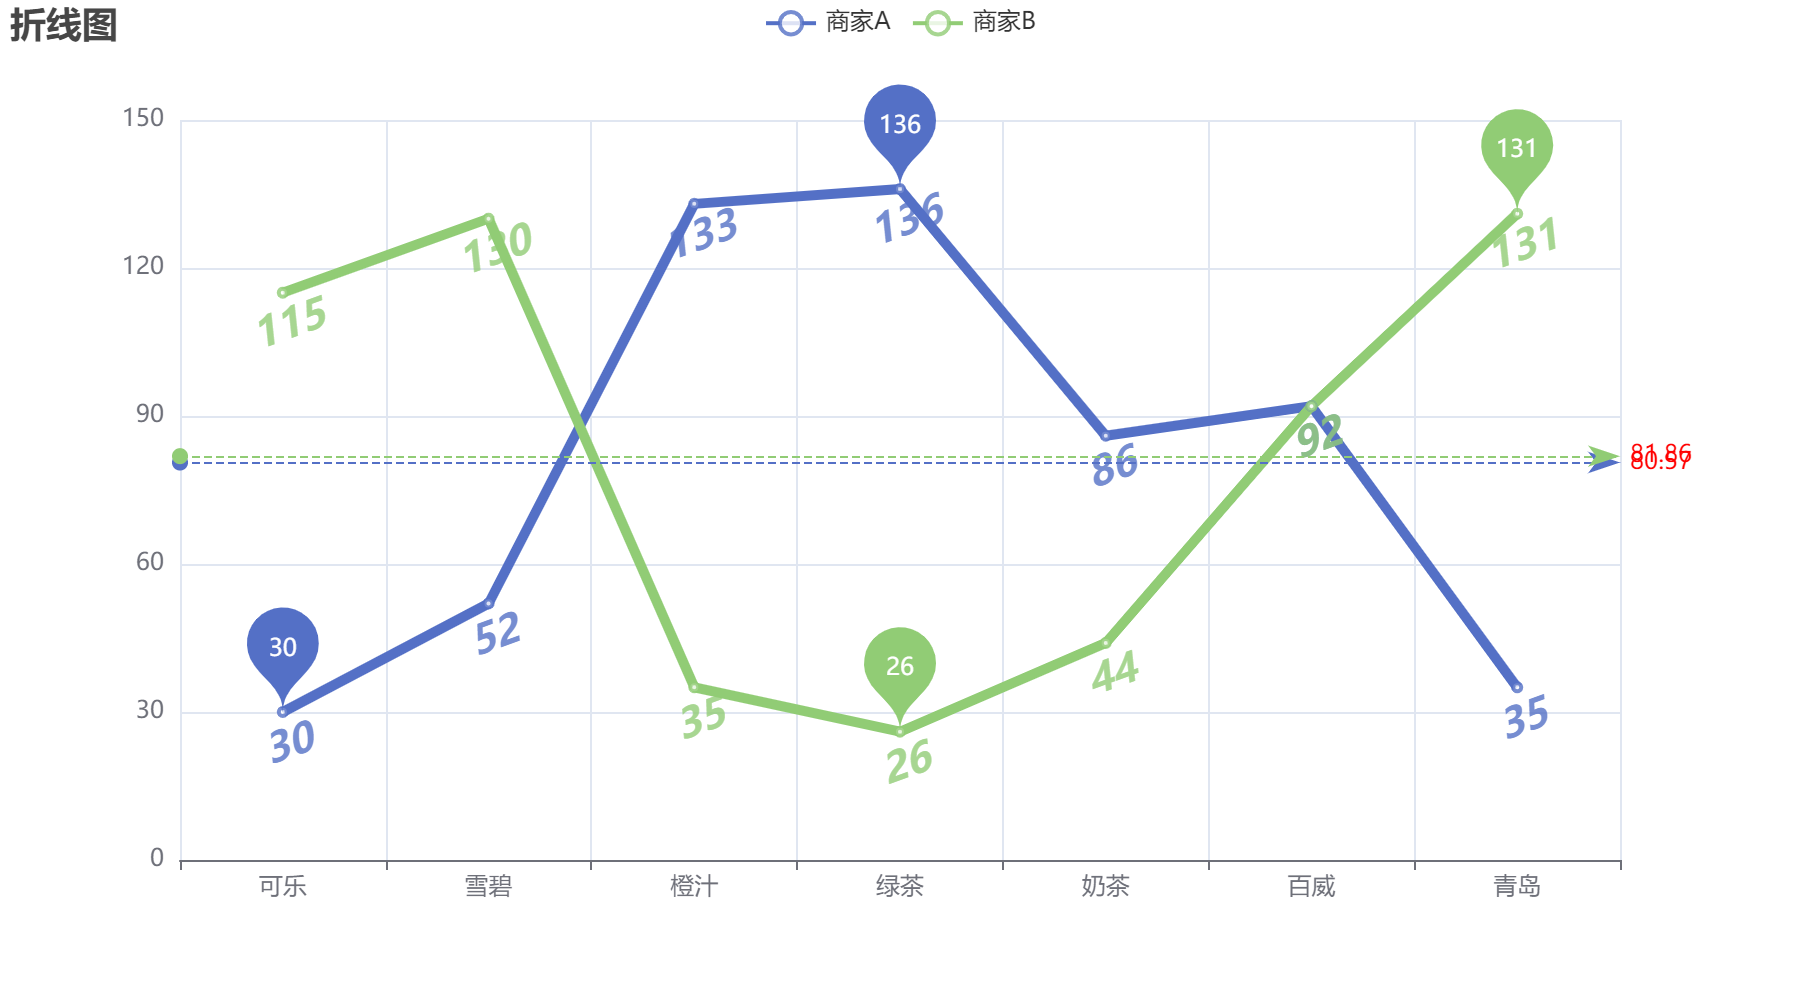
pyecharts配置项
https://meteor-comet.github.io/posts/pyecharts-opts/